Menu
Call
Contact
Blog

How California Counts Police Shootings: Los Angeles County, the South Bay, and San Bernardino County by Agency (2025 Data)

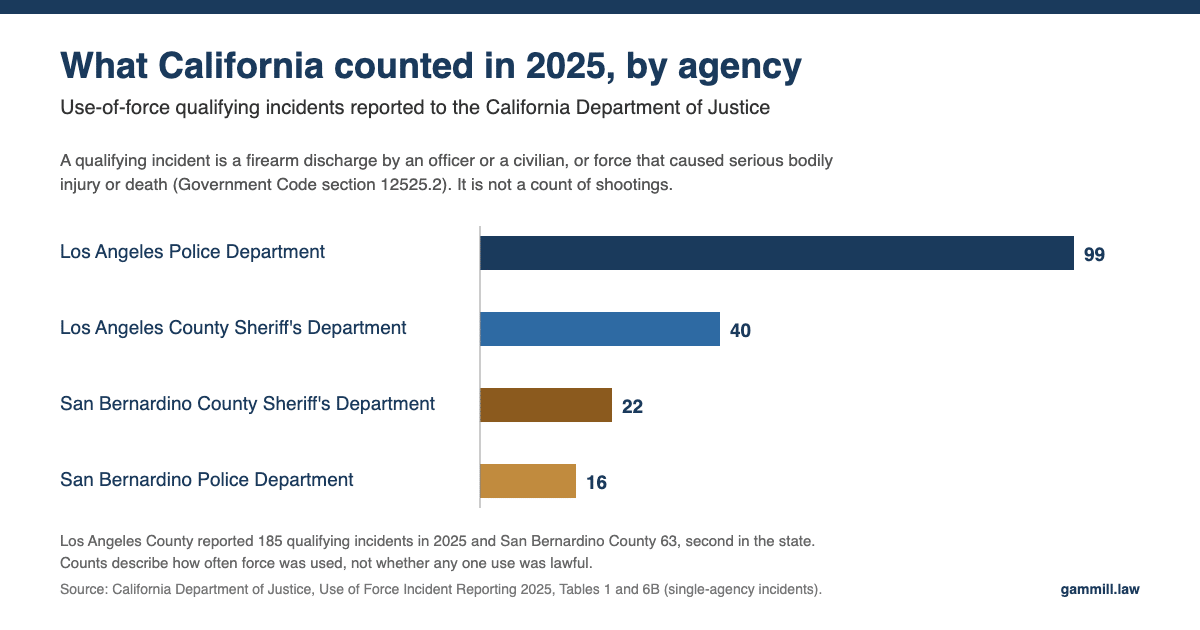
California use-of-force qualifying incidents in 2025 by agency: LAPD 99, LASD 40, San Bernardino Sheriff 22, San Bernardino PD 16, with the state definition

Reviewed by David Gammill, California trial attorney · Last reviewed: October 18, 2026

California does not publish a count of police shootings. It publishes a count of use-of-force incidents that meet one narrow definition: an officer or a civilian discharged a firearm, or the force used caused serious bodily injury or death. In 2025, 619 incidents met that definition statewide, 185 of them in Los Angeles County and 63 in San Bernardino County. This page explains what that number is, what it is not, and how it breaks down by agency, including the Sheriff’s stations that police the South Bay.

The Bottom Line

  • The state counts “qualifying incidents,” not shootings: a firearm discharge by anyone, or force that caused serious bodily injury or death. Of the 619 incidents in 2025, 242 involved a firearm discharge; 204 people were hit and 127 people died.
  • Los Angeles County is the largest share and it grew: 164 qualifying incidents in 2023, 158 in 2024, and 185 in 2025, almost 30 percent of the statewide total.
  • San Bernardino County is now second in the state: 52, then 54, then 63 incidents, ahead of San Diego County (50) and Riverside County (31) in 2025.
  • By agency, two departments carry most of Los Angeles County: the Los Angeles Police Department reported 99 incidents in 2025 and the Sheriff’s Department reported 40. Gardena and Redondo Beach reported one each.
  • None of these numbers decide a civil case: they describe how often force is used, not whether a particular shooting was lawful. That question is answered by the facts of one incident, under the deadlines explained below.

If an officer shot someone in your family, call 310-750-4149. The consultation is free, and the government-claim clock that applies to these cases is short.

California use-of-force qualifying incidents in 2025 by agency: LAPD 99, LASD 40, San Bernardino Sheriff 22, San Bernardino PD 16, with the state definition

What Does California Actually Count?

The California Department of Justice counts incidents that meet Government Code section 12525.2, and nothing else. Since 2017, every law enforcement agency in the state has had to report an incident to the Department of Justice when an officer shoots a civilian, a civilian shoots an officer, or force used by either side results in serious bodily injury or death. The Department publishes the results once a year in a report called Use of Force Incident Reporting. Its own executive summary warns that the data “only represents incidents” meeting that definition and “does not contain the full spectrum of California’s use of force incidents.” A takedown that breaks an arm is in the count. A baton strike that leaves a bruise is not. A shot that misses is in the count, because any discharge of a firearm qualifies.

Three years of that report give a stable statewide line: 638 qualifying incidents in 2023, 581 in 2024, and 619 in 2025. The 2025 report, published in July 2026, breaks the 619 down this way: 242 incidents involved a firearm discharge and 377 did not. Among the 633 civilians involved, 204 were hit by gunfire and 42 were shot at and missed. 127 civilians died, 322 suffered serious bodily injury, and 94 had a lesser injury. 1,257 officers were involved; 224 were injured and 5 died. The state changed its collection system in 2023 and moved agencies to monthly reporting in 2024, and the Attorney General’s release of the 2025 reports says the state is still transitioning agencies to the new system, so a one-year change of a few dozen incidents is not evidence of a trend in either direction.

The report also records what officers saw. In 2025, officers perceived 194 of the 204 people hit by gunfire as armed before firing; after the fact, 191 of the 204 were confirmed armed, 13 were confirmed unarmed, and 19 had been carrying a replica firearm. Officers recorded signs of a mental disability in 99 of the 633 civilians and signs of drug impairment in 82, and 31 of the 619 incidents began as a medical, mental health, or welfare call. These are the officers’ own entries on a state form, made after the incident, and they are not findings by anyone else.

By race, the Department of Justice reports that 50.7 percent of the civilians in 2025 qualifying incidents were Hispanic, 26.9 percent white, and 17.5 percent Black. The report publishes those shares without a population or contact denominator, so by itself it does not say how any group’s rate compares with its share of the population or of police stops. Anyone who tells you the state report proves or disproves a disparity is adding something the report does not contain.

How Do Los Angeles County and San Bernardino County Compare With the Rest of the State?

Los Angeles County has had the largest share of qualifying incidents in every year of the series, and San Bernardino County moved into second place in 2025. The state counts each incident in the county where it happened, including California Highway Patrol incidents, so these are counts of place, not of any one agency. Table 1 of each report reads as follows for the five largest Southern California counties.

County of incident202320242025Share of state, 2025
Los Angeles16415818529.9%
San Bernardino52546310.2%
San Diego4948508.1%
Orange3429345.5%
Riverside5043315.0%
California638581619100%
Qualifying use-of-force incidents by county of initial contact, California Department of Justice, Use of Force Incident Reporting 2023, 2024 and 2025, Table 1.

Two things in that table deserve a plain reading. Los Angeles County’s number moved up by 27 incidents in one year while the state’s moved up by 38, so the county accounted for most of the statewide increase. And San Bernardino County reported a third as many incidents as Los Angeles County and more than twice as many as Riverside County, the other Inland Empire county. The report does not say why. It records where incidents happened, not what policies, call volumes, or reporting practices produced them.

Which Agencies Account for the Los Angeles County Numbers?

In 2025, the Los Angeles Police Department reported 99 qualifying incidents and the Los Angeles County Sheriff’s Department reported 40, together three quarters of the county’s 185. The Department of Justice lists every reporting agency in Table 6B, and separate tables list how many people in each agency’s incidents were seriously injured (Table 23) or died (Table 24). The agencies below are the two largest and the South Bay departments.

Agency (2025)Qualifying incidentsCivilians seriously injuredCivilians who died
Los Angeles Police Department995216
Los Angeles County Sheriff’s Department40279
Santa Monica Police Department1360
Long Beach Police Department410
Gardena Police Department101
Redondo Beach Police Department100
California Department of Justice, Use of Force Incident Reporting 2025, Tables 6B, 23 and 24. Single-agency incidents; one Burbank and Glendale incident is listed separately as a multiple-agency incident.

The Sheriff’s line is the South Bay line for most of the cities around Torrance. The Sheriff’s Department polices Carson, Lawndale, and Lomita under contract, and its Lomita Station also serves Rancho Palos Verdes, Rolling Hills, and Rolling Hills Estates, so a deputy-involved shooting in any of those cities lands in the Sheriff’s 40, not in a city row. Torrance, Gardena, Redondo Beach, Hermosa Beach, Manhattan Beach, El Segundo, Hawthorne, Inglewood, and Palos Verdes Estates run their own departments, and only the ones that reported a qualifying incident appear in the table; the others reported zero for 2025. Adding up every Los Angeles County row in Table 24, 37 people died in the county’s qualifying incidents in 2025. The California Highway Patrol’s deaths are reported statewide and are not in that sum.

If a Sheriff’s deputy or an LAPD officer shot someone in your family, the agency-level number is background. What matters is the one incident. Our page on police shooting cases in Los Angeles explains the legal standard, who investigates, and what the family’s claim and the estate’s claim can recover.

Which Agencies Account for the San Bernardino County Numbers?

The San Bernardino County Sheriff’s Department reported 22 qualifying incidents in 2025 and the San Bernardino Police Department reported 16, more than half of the county’s 63 between them. The Sheriff’s Department provides contract police services to 14 of the county’s 24 cities and towns, so, as in Los Angeles County, the Sheriff’s row covers many places. The California Highway Patrol reported 3 incidents in the county, listed under the CHP rather than the county.

Agency (2025)Qualifying incidentsCivilians seriously injuredCivilians who died
San Bernardino County Sheriff’s Department22155
San Bernardino Police Department1684
Ontario Police Department860
Chino Police Department320
Montclair Police Department320
Fontana Police Department202
Upland Police Department211
Colton Police Department110
Barstow Police Department101
California Department of Justice, Use of Force Incident Reporting 2025, Tables 6B, 23 and 24. Single-agency incidents; two multiple-agency incidents (Sheriff’s Department with Upland, and CHP with Ontario) are listed separately.

Adding up every San Bernardino County row in Table 24, 13 people died in the county’s qualifying incidents in 2025. Our page on police shooting cases in San Bernardino County covers where those cases are filed and how the Sheriff’s contract-city structure affects who the defendant is.

Why Is LAPD’s Own Count So Different From the State’s?

Because LAPD counts shootings and the state counts qualifying incidents. LAPD’s 2024 Use of Force Year-End Review reports 29 officer-involved shootings in 2024, down from 34 in 2023, in a five-year series of 27, 37, 31, 34 and 29 for 2020 through 2024. Of the 29, 22 were “hit” shootings in which someone was struck and 7 were “no-hit” shootings. The same review puts those 29 shootings against 1,122,025 documented public contacts in 2024. The state’s figure for LAPD is far larger because it adds every incident in which force of any kind caused serious bodily injury or death, and every incident in which a civilian fired at an officer. Neither number is wrong. They answer different questions, and a page that quotes one as if it were the other is misreading its source.

The Sheriff’s Department does not publish a comparable annual shooting count in one document. The county’s Office of Inspector General reports on every deputy-involved shooting each quarter; its report for October through December 2025, issued in February 2026, lists three incidents in which people were shot or shot at by Sheriff’s personnel, two of them fatal, and notes that the Inspector General’s staff did not respond to the scenes because scene rollouts were suspended in June 2025. The Sheriff’s Department also maintains a public page listing deputy-involved shootings that resulted in injury or death, with incident summaries and video. Those are the places to look for a specific incident; the state report never names one.

Why Can’t These Numbers Rank Cities or Prove a Trend?

Because the counts are small, the definition is narrow, and the Sheriff’s row hides which city an incident happened in. Gardena reported one qualifying incident in 2025 and Redondo Beach reported one. A city at one incident is one incident away from doubling and one away from zero; nothing about next year’s number will tell you whether policing in that city changed. The Sheriff’s 40 incidents are spread across dozens of stations from Lancaster to Lomita, and the state report does not break them out by city, so the South Bay’s share of the Sheriff’s number is unknowable from this source. The Department of Justice says in the report itself that caution is required “when using the data for comparisons or when calculating rates,” and that is the correct reading. The right uses of these numbers are the modest ones: the state’s definition, the county’s order of magnitude, and which agencies generate most of the county’s incidents.

What Happens After a Police Shooting, and Why None of It Is Your Civil Case?

A shooting by a Los Angeles County deputy or an LAPD officer sets off several reviews, and none of them decides whether the family can recover. The agency’s own investigators work the scene. The District Attorney’s office reviews whether the officer committed a crime. The Inspector General or the Police Commission reviews policy. Under Government Code section 12525.3, the state Attorney General’s office investigates when an officer’s shooting kills a person who was not armed. Each of those reviews answers its own question, and a finding that a shooting was “in policy” or that no charges will be filed is not a finding that the shooting was lawful under the civil standard. The civil case is brought by the family and the estate, it is decided by a jury on the evidence, and it runs on its own clock: a written government claim within six months when the officer worked for a city or county, then the lawsuit. Our pages on who can bring a wrongful death claim and the six-month government claim deadline explain those rules, and the two-year statute of limitations applies to the lawsuit itself.

The evidence that decides the civil case is specific: the body-worn camera footage, the dispatch audio, the physical evidence, the training the officer received, and what the officer could see in the seconds before firing. Our pages on how excessive force is judged and why bodycam footage matters explain what to ask for and how fast it has to be requested.

Frequently Asked Questions About California’s Police Shooting Data

Is a “qualifying incident” the same as a police shooting?

No. Every police shooting is a qualifying incident, because any discharge of a firearm counts, but most qualifying incidents in 2025 were not shootings: 377 of the 619 involved no firearm. When a page says an agency had a certain number of “shootings” and cites the state report, check whether it is quoting Table 1 or Table 6B, which count incidents of every kind, or the firearm rows of Table 8A and 8B.

Does a higher number mean an agency uses force more aggressively?

Not by itself. The number reflects population, call volume, how many officers the agency fields, how many assaults on officers it records, and how carefully it reports. The state publishes population and sworn-personnel figures by county in Table 37 of each report, but even a per-capita rate compares counties, not agencies, and it still cannot say whether any one use of force was justified.

Where can I find information about a specific shooting?

The state report never identifies an incident. For a Sheriff’s Department shooting, the Office of Inspector General’s quarterly reports and the Sheriff’s deputy-involved shootings page carry incident summaries. For an LAPD shooting, the Police Commission’s public agendas and the Department’s critical incident video releases are the public record. For a case you are involved in, a lawyer obtains the full investigative file, which is far more than any public page shows.

Will the state’s numbers be used in my case?

Rarely, and never to prove that one shooting was unlawful. A civil rights case is decided on what happened in that incident, measured against what a reasonable officer would have done. Agency-level statistics can matter in a narrow kind of claim against the city or county itself, where a pattern of conduct is the issue, and that is a question for the lawyer who reviews your facts.

Related Pages

Sources

About Gammill Law

David Gammill is a former Los Angeles County Deputy District Attorney who has tried over 100 cases to verdict, first as a prosecutor and then as a trial lawyer for injured people. Every case is different, and past results do not guarantee a similar outcome. Gammill Law Accident & Injury Lawyers represents people in personal injury, wrongful death, and civil rights cases across California, and its attorneys bring more than 40 years of combined legal experience to every case they take. The firm has recovered more than $100 million for California clients across verdicts and settlements. Its results include a $21.1 million wrongful death verdict, a $16 million school sexual abuse verdict, and a $12 million whistleblower retaliation verdict; every case is different, and prior results do not guarantee a similar outcome. You can read more on our case results page. Consultations are free, there is no fee unless the firm recovers, and the firm takes calls in English and Spanish. Call 310-750-4149 or request a free case evaluation.

If an officer shot you or someone you love and you do not know what to do first, call 310-750-4149. We will tell you what to request, what to preserve, and which deadline is already running. Our no-win, no-fee guide explains how the fee agreement works.

This page is attorney advertising and general information, not legal advice for any specific situation. Deadlines and outcomes are fact-specific; consult a licensed California attorney about your own circumstances. Prior results do not guarantee a similar outcome.

My name is David Gammill. I am a California trial lawyer and the founder of Gammill Law Accident & Injury Lawyers. Our firm has recovered more than $100 million for California clients. Our results include a $21.1 million wrongful death verdict, a $16 million school sexual abuse verdict, and a $12 million whistleblower retaliation verdict. I learned to try cases in front of juries early in my career as a Deputy District Attorney, and trying cases remains the backbone of my practice.

Ask Gammill AI Calculator