

GET A FREE CONSULTATION
310-750-4149

$100,000,000+
Recovered for Clients
$21,100,000
Wrongful Death VERDICT
$16,000,000
School Sexual Abuse VERDICT
$12,000,000
Whistleblower Retaliation VERDICT
Reviewed by David Gammill, California trial attorney · Last reviewed: November 14, 2026. Figures come from the California Department of Justice’s use-of-force data files, read on that date.
From 2016 through 2025, California law enforcement agencies reported 2,704 incidents in which an officer fired a gun at a person. In those incidents 2,245 people were struck by gunfire, and 1,329 of them died. This page breaks those figures down by year, by all 58 counties and by agency, using the state’s own records.
If an officer shot someone in your family, call 310-750-4149. The consultation is free, and the deadline for a claim against a government agency is short.
California requires every law enforcement agency to report certain use-of-force incidents to the Department of Justice under Government Code section 12525.2. The state’s published totals mix several things together: shootings by officers, shootings at officers, and any force that caused serious injury or death. Our guide to how California counts police shootings explains that definition in detail.
This page uses the state’s incident-level files to count something narrower and easier to understand:
People who were fired at and missed are counted in the incidents and not among the people shot.
| Year | Incidents in which an officer fired at a person | People shot | People shot who died |
|---|---|---|---|
| 2016 | 311 | 257 | 143 |
| 2017 | 336 | 272 | 156 |
| 2018 | 264 | 225 | 119 |
| 2019 | 277 | 231 | 131 |
| 2020 | 301 | 238 | 160 |
| 2021 | 276 | 233 | 140 |
| 2022 | 244 | 197 | 125 |
| 2023 | 241 | 205 | 127 |
| 2024 | 216 | 183 | 108 |
| 2025 | 238 | 204 | 120 |
| Total | 2,704 | 2,245 | 1,329 |
Two cautions on the trend. 2016 was the first year of reporting and is known to be incomplete. And in 2023 the state stopped collecting some categories, so the years before and after are not measured in exactly the same way.
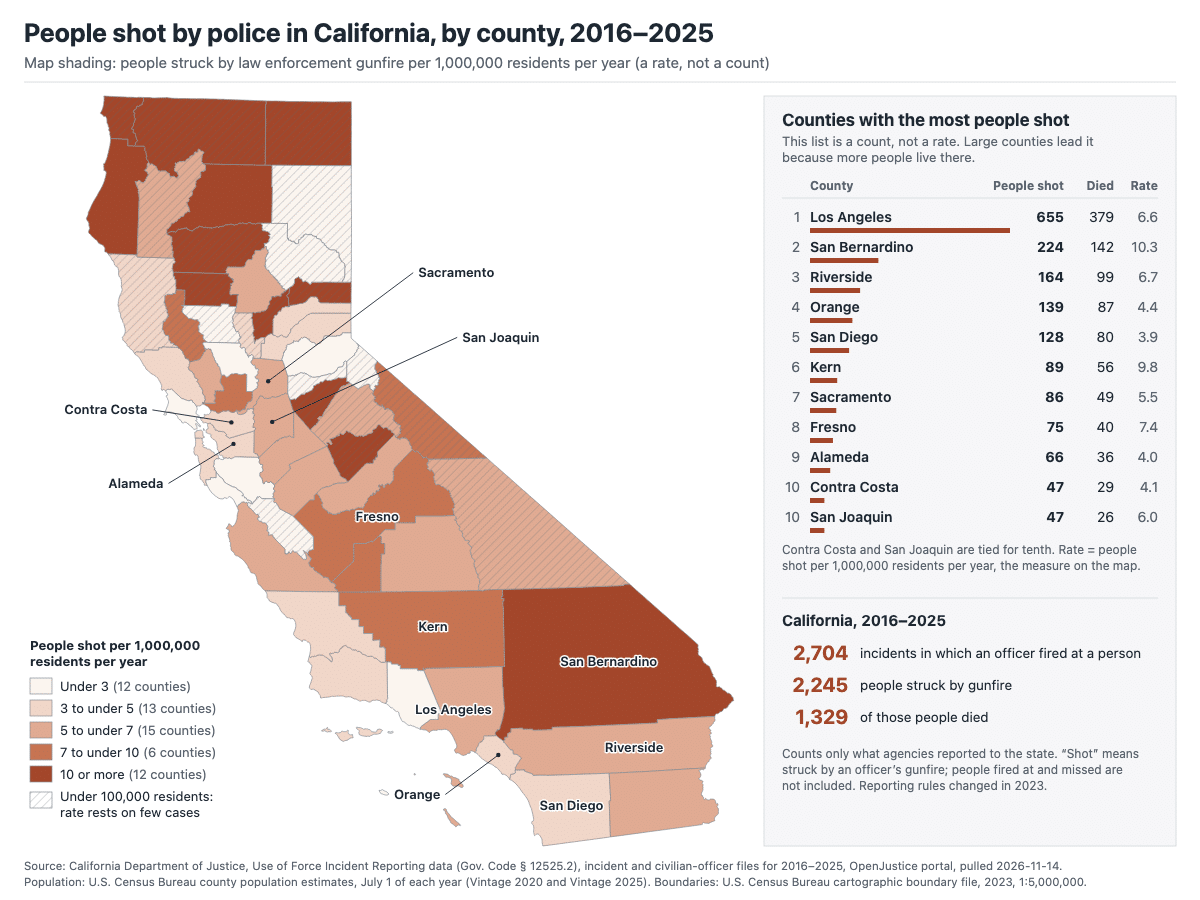
The table lists all 58 counties, ordered by the number of people shot. The last column is the rate: people shot per million residents per year. Count and rate answer different questions. Los Angeles County leads the count because ten million people live there; its rate is close to the state’s. An incident is counted in the county where it happened, whichever agency was involved.
| Rank | County | Incidents | People shot | Died | Shot per million residents per year |
|---|---|---|---|---|---|
| 1 | Los Angeles | 833 | 655 | 379 | 6.62 |
| 2 | San Bernardino | 280 | 224 | 142 | 10.26 |
| 3 | Riverside | 204 | 164 | 99 | 6.66 |
| 4 | Orange | 154 | 139 | 87 | 4.39 |
| 5 | San Diego | 154 | 128 | 80 | 3.88 |
| 6 | Kern | 102 | 89 | 56 | 9.82 |
| 7 | Sacramento | 96 | 86 | 49 | 5.47 |
| 8 | Fresno | 92 | 75 | 40 | 7.44 |
| 9 | Alameda | 83 | 66 | 36 | 4.00 |
| 10 | Contra Costa | 56 | 47 | 29 | 4.06 |
| 11 | San Joaquin | 50 | 47 | 26 | 6.02 |
| 12 | Santa Clara | 55 | 42 | 26 | 2.20 |
| 13 | Stanislaus | 35 | 34 | 20 | 6.17 |
| 14 | San Francisco | 39 | 33 | 20 | 3.89 |
| 15 | Solano | 38 | 33 | 13 | 7.35 |
| 16 | Tulare | 33 | 32 | 15 | 6.77 |
| 17 | Monterey | 34 | 27 | 11 | 6.21 |
| 18 | Shasta | 26 | 25 | 19 | 13.84 |
| 19 | San Mateo | 25 | 24 | 14 | 3.19 |
| 20 | Santa Barbara | 24 | 21 | 17 | 4.73 |
| 21 | Ventura | 28 | 20 | 9 | 2.38 |
| 22 | Merced | 19 | 17 | 10 | 5.99 |
| 23 | Placer | 17 | 17 | 11 | 4.15 |
| 24 | Humboldt | 19 | 16 | 10 | 11.85 |
| 25 | Sonoma | 18 | 16 | 5 | 3.26 |
| 26 | Tehama* | 18 | 15 | 8 | 23.17 |
| 27 | Butte | 17 | 14 | 11 | 6.50 |
| 28 | Yuba* | 16 | 12 | 9 | 14.66 |
| 29 | Imperial | 12 | 12 | 8 | 6.65 |
| 30 | San Luis Obispo | 12 | 12 | 9 | 4.25 |
| 31 | Kings | 11 | 11 | 7 | 7.22 |
| 32 | Madera | 10 | 10 | 6 | 6.27 |
| 33 | Siskiyou* | 10 | 10 | 6 | 23.08 |
| 34 | Napa | 10 | 8 | 8 | 5.86 |
| 35 | Santa Cruz | 10 | 8 | 2 | 2.99 |
| 36 | Del Norte* | 7 | 6 | 4 | 22.04 |
| 37 | Lake* | 5 | 6 | 4 | 9.01 |
| 38 | Calaveras* | 7 | 5 | 4 | 10.85 |
| 39 | El Dorado | 6 | 5 | 2 | 2.61 |
| 40 | Nevada | 5 | 5 | 3 | 4.94 |
| 41 | Sutter* | 5 | 4 | 1 | 4.09 |
| 42 | Glenn* | 3 | 4 | 1 | 14.15 |
| 43 | Mariposa* | 4 | 3 | 2 | 17.49 |
| 44 | Mendocino* | 4 | 3 | 2 | 3.38 |
| 45 | Tuolumne* | 3 | 3 | 3 | 5.53 |
| 46 | Marin | 2 | 2 | 0 | 0.77 |
| 47 | Yolo | 2 | 2 | 2 | 0.91 |
| 48 | Inyo* | 2 | 1 | 0 | 5.47 |
| 49 | Amador* | 1 | 1 | 1 | 2.48 |
| 50 | Modoc* | 1 | 1 | 0 | 11.51 |
| 51 | Mono* | 1 | 1 | 1 | 7.40 |
| 52 | San Benito* | 1 | 1 | 0 | 1.54 |
| 53 | Sierra* | 1 | 1 | 0 | 32.28 |
| 54 | Trinity* | 1 | 1 | 1 | 6.87 |
| 55 | Lassen* | 1 | 0 | 0 | 0.00 |
| 56 | Plumas* | 1 | 0 | 0 | 0.00 |
| 57 | Alpine* | 0 | 0 | 0 | 0.00 |
| 58 | Colusa* | 0 | 0 | 0 | 0.00 |
* Fewer than 100,000 residents. In these counties one incident moves the rate a long way, so the rate says little. Sierra County has the highest rate in the state on a single person shot in ten years. One 2025 incident has no county recorded in the state file, so the county rows add up to 2,244 people shot, one fewer than the state total.
Among counties with at least 100,000 residents, the highest rates are in Shasta (13.8), Humboldt (11.9), San Bernardino (10.3) and Kern (9.8). The lowest are in Marin (0.8), Yolo (0.9) and Santa Clara (2.2).
| Rank | Agency | County | Incidents | People shot | Died |
|---|---|---|---|---|---|
| 1 | Los Angeles Police Department | Los Angeles | 347 | 254 | 142 |
| 2 | Los Angeles County Sheriff’s Department | Los Angeles | 244 | 195 | 111 |
| 3 | San Bernardino County Sheriff’s Department | San Bernardino | 149 | 111 | 66 |
| 4 | California Highway Patrol | Statewide | 126 | 96 | 62 |
| 5 | Riverside County Sheriff’s Department | Riverside | 101 | 87 | 56 |
| 6 | San Diego Police Department | San Diego | 67 | 54 | 40 |
| 7 | Fresno Police Department | Fresno | 55 | 46 | 23 |
| 8 | San Bernardino Police Department | San Bernardino | 51 | 41 | 28 |
| 9 | Long Beach Police Department | Los Angeles | 44 | 38 | 22 |
| 10 | Sacramento County Sheriff’s Department | Sacramento | 40 | 36 | 25 |
| 11 | San Diego County Sheriff’s Department | San Diego | 40 | 36 | 17 |
| 12 | Bakersfield Police Department | Kern | 42 | 35 | 22 |
| 13 | Kern County Sheriff’s Department | Kern | 39 | 34 | 21 |
| 14 | San Francisco Police Department | San Francisco | 36 | 31 | 21 |
| 15 | Sacramento Police Department | Sacramento | 34 | 31 | 15 |
| 16 | San Jose Police Department | Santa Clara | 32 | 27 | 17 |
| 17 | Anaheim Police Department | Orange | 31 | 26 | 17 |
| 18 | Stockton Police Department | San Joaquin | 26 | 25 | 13 |
| 19 | Santa Ana Police Department | Orange | 22 | 23 | 15 |
| 20 | Orange County Sheriff’s Department | Orange | 22 | 19 | 10 |
| 21 | Riverside Police Department | Riverside | 22 | 17 | 8 |
| 22 | Fontana Police Department | San Bernardino | 17 | 17 | 13 |
| 23 | Redding Police Department | Shasta | 17 | 17 | 11 |
| 24 | Modesto Police Department | Stanislaus | 17 | 17 | 8 |
“Agency” means the agency that filed the report with the state. Some incidents involve officers from more than one agency, and a sheriff’s department polices many cities under contract, so its row covers all of them. In the South Bay, the Torrance Police Department reported 9 incidents in the ten years, in which 8 people were shot and 6 died.
The state form asks what weapon, if any, was confirmed after the incident. For the 2,245 people shot, agencies recorded a firearm for 1,027 (45.7 percent), a knife or other blade for 533 (23.7 percent), another dangerous weapon for 238 (10.6 percent) and a replica firearm for 135 (6.0 percent). No weapon was recorded for 312 (13.9 percent).
These are the agencies’ own entries, made after the fact. They are not findings by a court or an outside investigator, and they do not say whether any particular shooting was lawful.
The county table is available as a file: California police shootings by county, 2016 to 2025 (CSV). To cite this page: Gammill Law, “Police Shootings in California by County and Agency: 2016 to 2025,” published November 14, 2026, https://www.gammill.law/police-shootings-california-by-county/. The underlying records come from the California Department of Justice.
Statistics are background. A civil case turns on one incident: what the officer knew, what the officer did, and whether deadly force was necessary. Our pages on police shooting cases in Los Angeles and police shooting cases in San Bernardino County explain the legal standard, who investigates, and the deadlines. Who may bring the claim is covered in our guide to CCP § 377.30. Our guide to Pitchess motions explains how an officer’s own records are obtained. Get a free case evaluation or call 310-750-4149.
Disclaimer: This article is educational and informational in nature. It does not constitute legal advice for any specific situation, and reading it does not create an attorney-client relationship. Every case turns on its own facts, and no result is guaranteed.
Free Case Review 1
This site is protected by reCAPTCHA and the Google Privacy Policy and Terms of Service apply.
